Microsoft Open Sources AI Debugging & Visualization Tool ‘TensorWatch’

Microsoft has open-sourced TensorWatch, a debugging and visualization tool aimed at reducing the complexities of artificial intelligence projects. It focuses more on one crucial part of the development process in particular and that is debugging.
Getting rid of errors is one of the most time-consuming jobs in software projects. Especially when it comes to AI development because of the complexity of machine learning models.
Microsoft’s AI debugging tool can reduce the complexity related to training metrics, the cost of getting information from the state of the system, etc. in deep learning models.
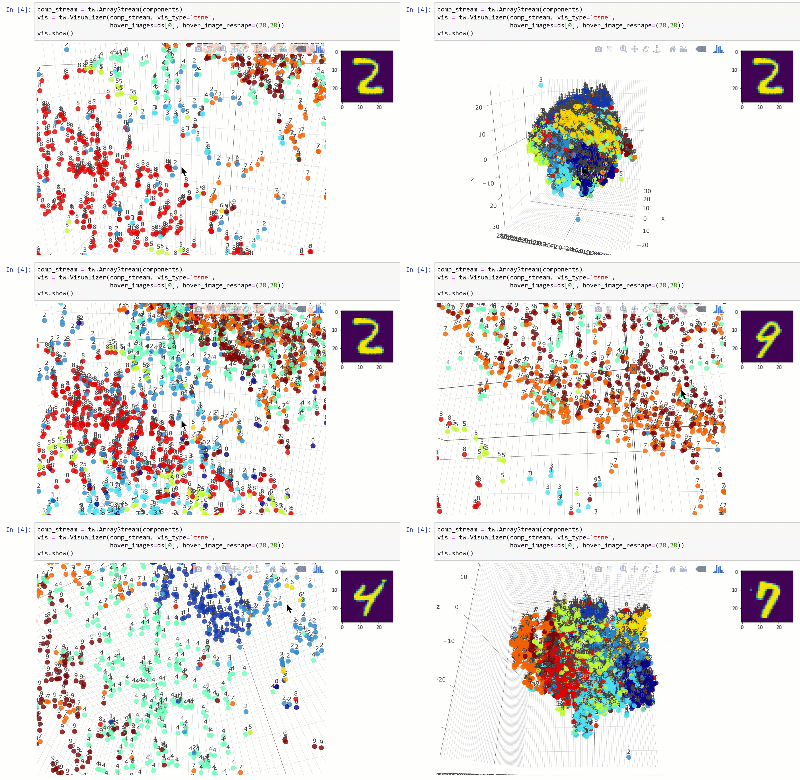
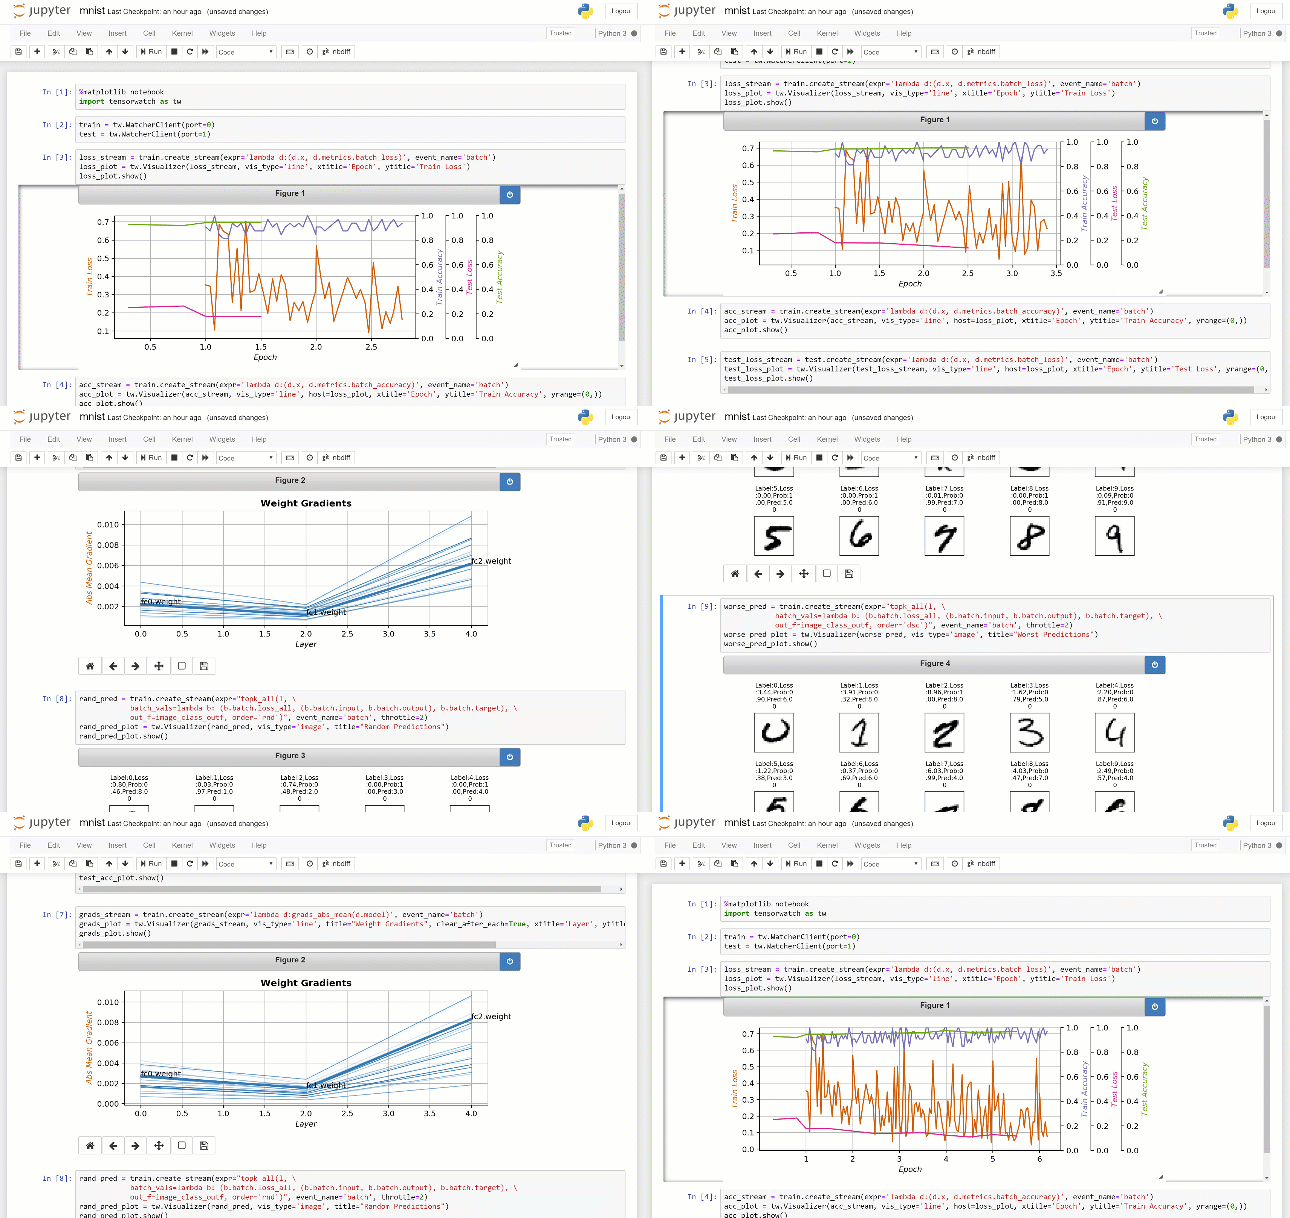
TensorWatch makes it easier to spot bugs by helping developers visualize their models in interactive graphs. It can generate graphs using the data produced by the AI model during testing.

ML developers can use TensorWatch to create custom visualizations, UIs, and dashboards. It can also be used to execute arbitrary queries against live ML training process. The tool can return a stream as a result of those queries and view a stream through any visualizer.

TensorWatch is essentially a Python library that uses Jupyter Notebook instead of prepackaged user interfaces (since Jupyter Notebook is easier to customize).
In addition to helping developers identify bugs in a visual fashion, this AI debugging tool makes troubleshooting more hardware-efficient. This is achieved by a dedicated feature called “Lazy Logger Mode.”
While the tool has a vast number of features, in a nutshell, one could say that TensorWatch can reduce processing overhead by cutting down the amount of data that needs to be processed to find problem patterns.
You can find the code for TensorWatch on GitHub.
Also Read: This DIY “Hackintosh” Is Going To Challenge Apple’s Beastly Mac Pro


