How To Make a Pie Chart in Google Sheets (2025)

Pie charts are perhaps the most common data visualisation tool, especially when illustrating comparisons or percentages. They allow you to easily see how each of the slices contributes to the total. Google Sheets gives you an immediate and simple way to create one. This is how you make a pie chart in Google Sheets.
How To Make a Pie Chart in Google Sheets?
The process to make a pie chart is fairly simple. Here’s how:
- Open Google Sheets and put your data into a table.
- Choose the columns and rows you want to add to the chart.
- Click on the Insert menu at the top.
- Choose Chart from the dropdown.
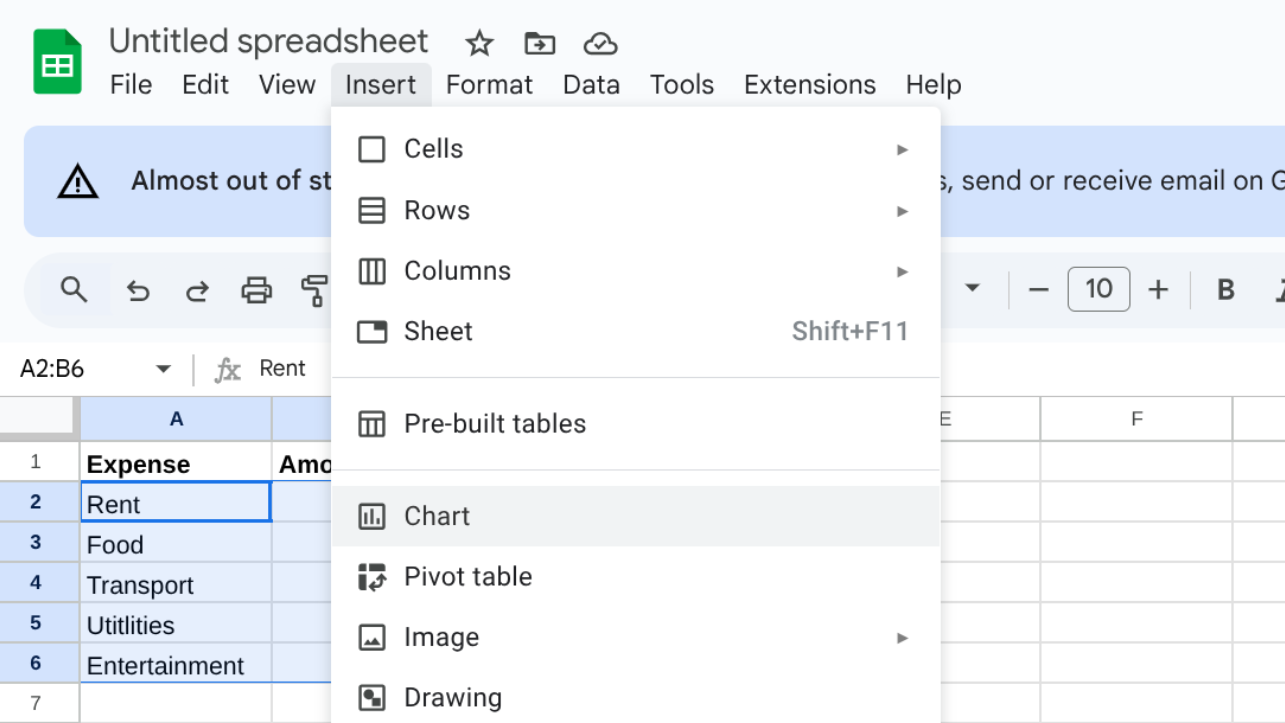
- Then, Google Sheets may display a different type of chart.
- Switch to Chart Editor on the right-hand side and convert it into a Pie chart.
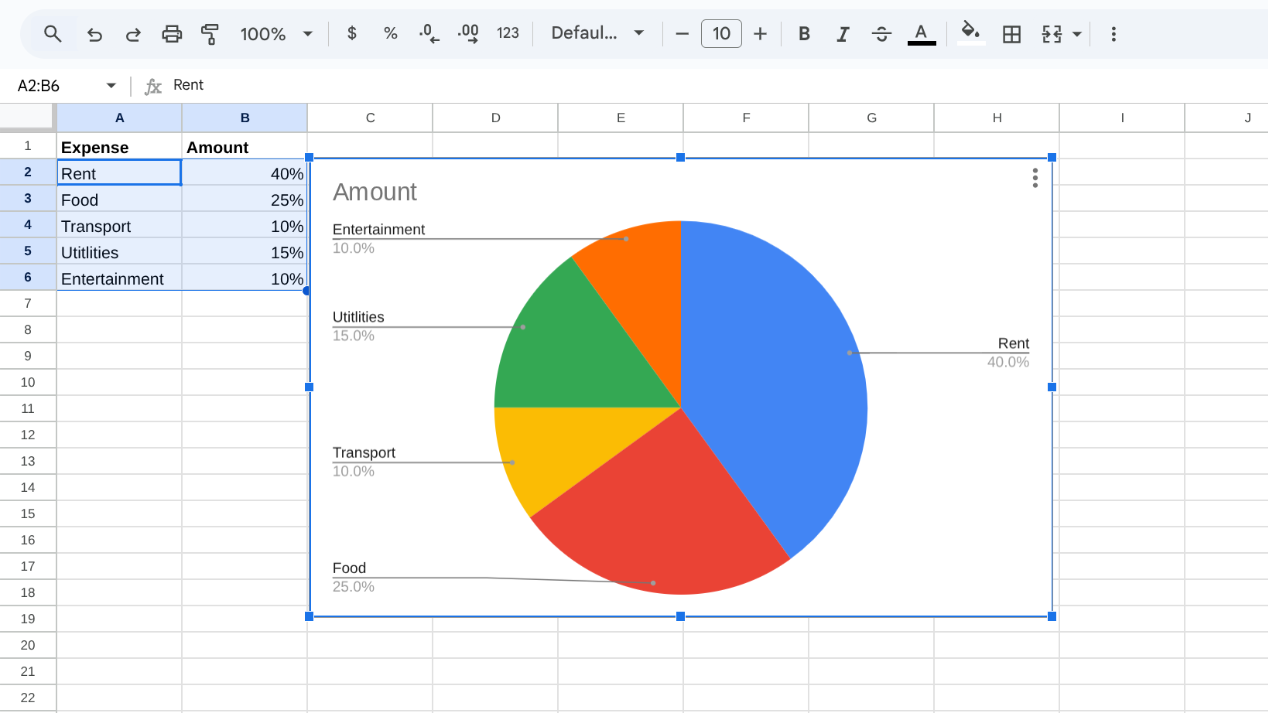
- Include personal touches within the text, design, and color spaces to make the text more readable.
How To Make a 3D Pie Chart in Google Sheets?
Here’s how you can continue the steps after making the regular pie chart to turn it into a 3D one:
- Once your pie chart is ready, open the Chart Editor on the right.
- Go to the Customize settings.
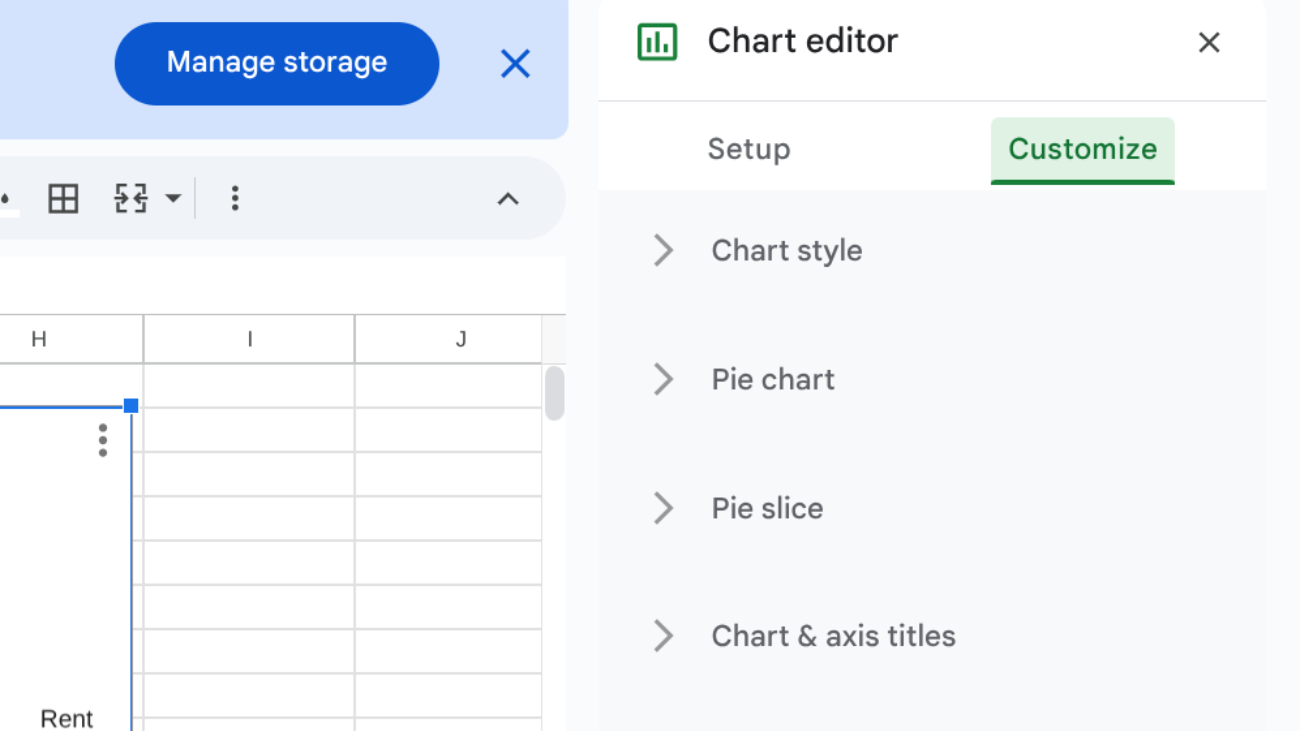
- Under Chart style, select the 3D box.
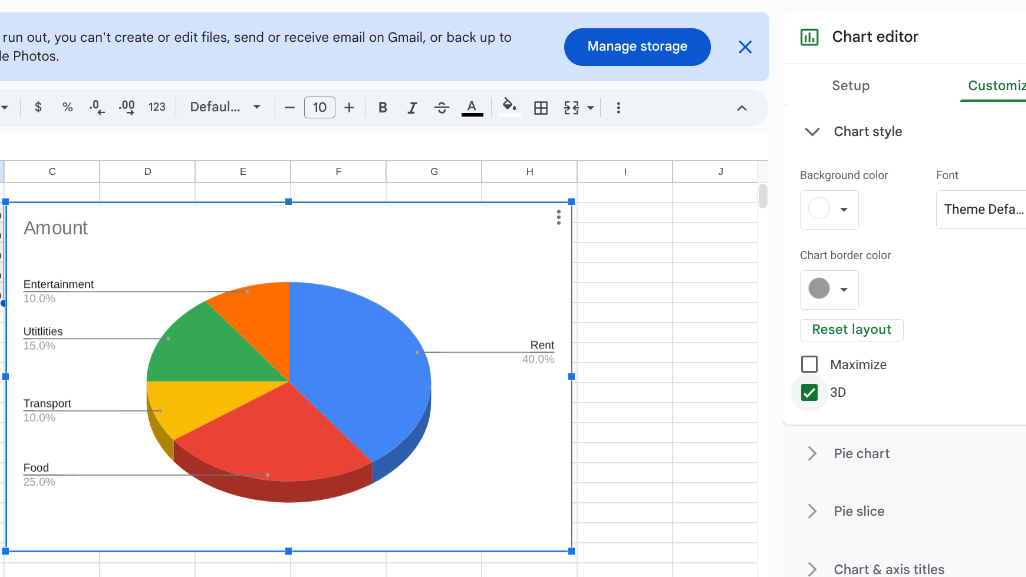
- Edit text, design, or colours as needed.
How To Make a Pie Chart with Percentages in Google Sheets?
Here are simple steps to make a pie chart with percentages:
- Click on your pie chart to open the Chart Editor on the right side.
- Go to the Customize tab and expand the Pie chart section.
- Under the Slice label, choose Percentage from the dropdown list.
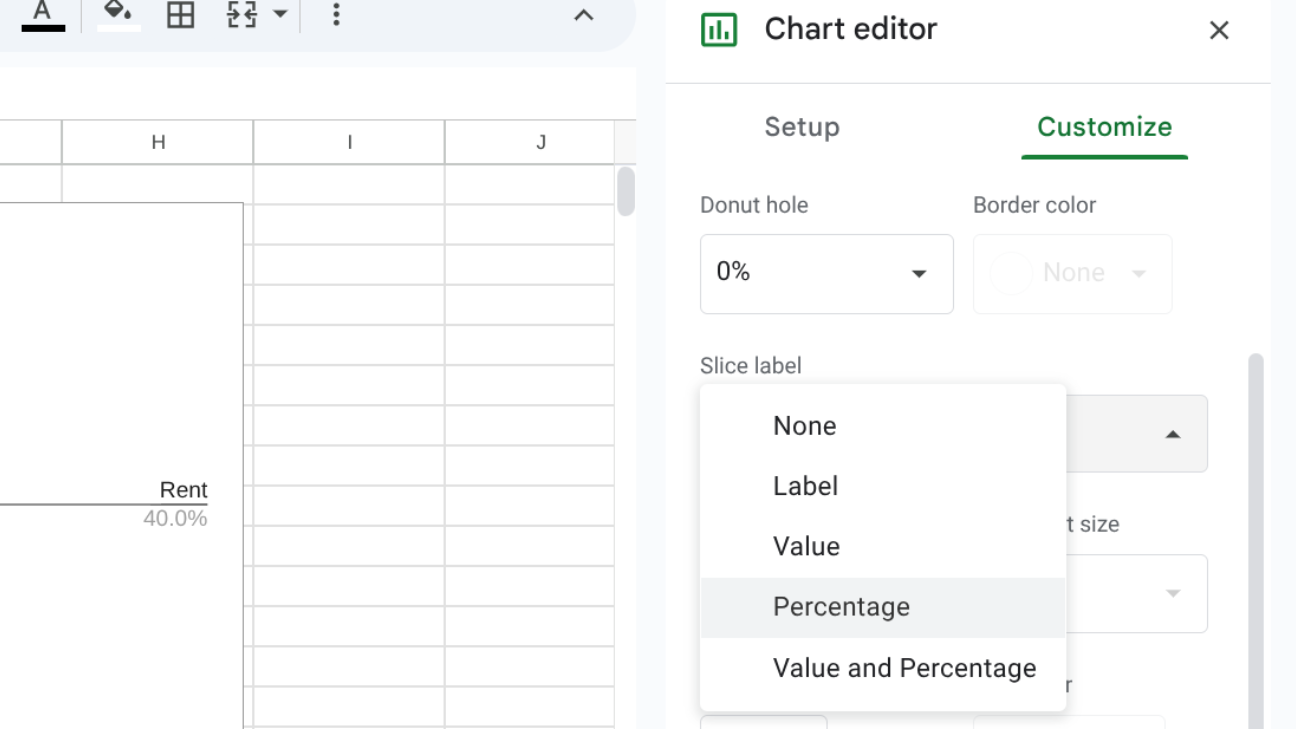
- Now, percentages will appear inside the slices, so you don’t need them in the legend.
- If you want to keep a legend, open the Legend section under Customize.
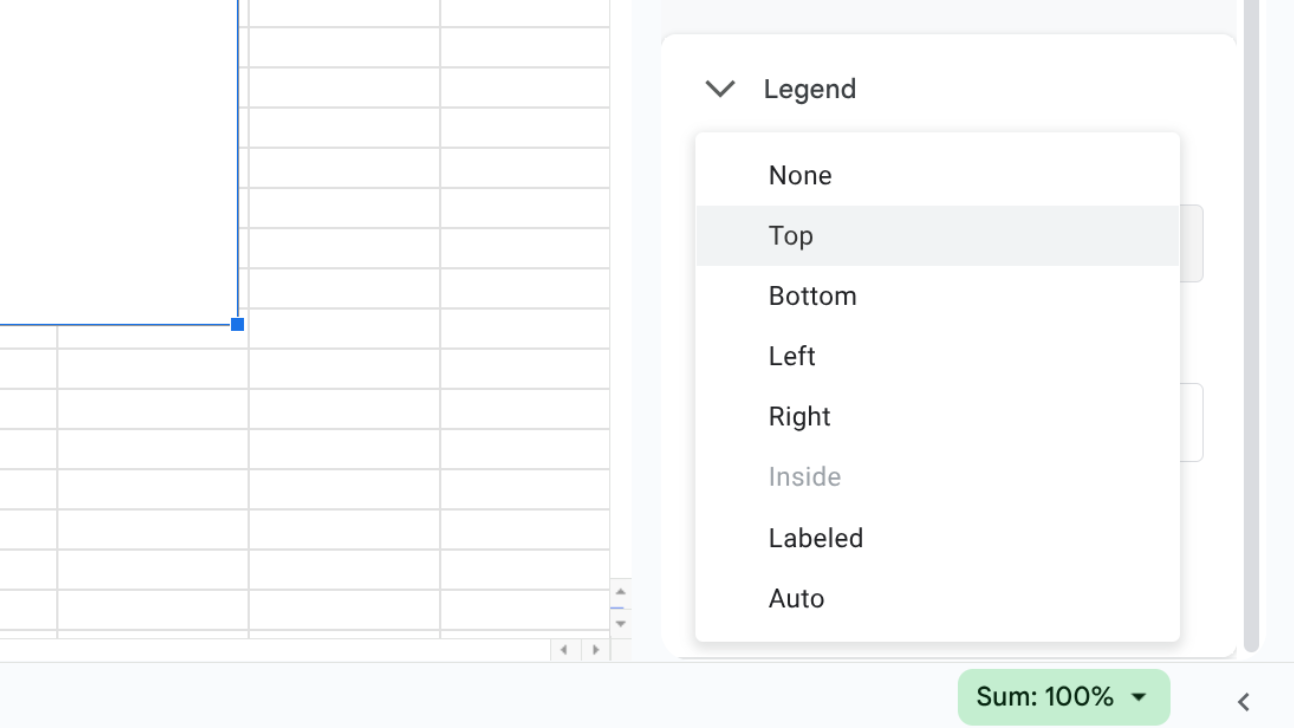
- From the Position dropdown, select where you’d like the legend to appear (top, bottom, left, or right).
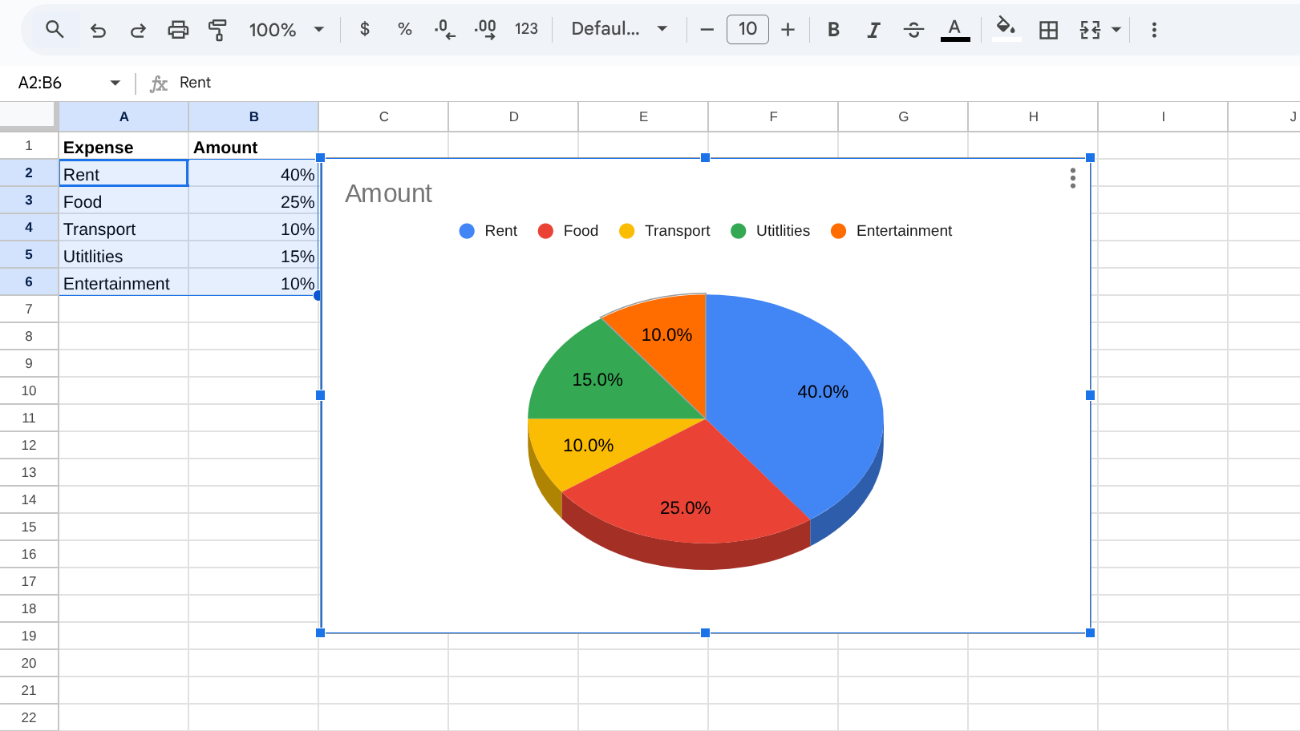
- Your chart will subsequently display both percentages in the slices, along with a legend to quickly identify them.
By following these steps, you can create a pie chart in minutes using Google Sheets. It’s a useful feature for anyone who wants to present data in a clearer way. With labels, colours, and design options, your chart can look both smart and professional.